Showing posts with label Reporting. Show all posts

Saturday, November 6

5 Ways to Save Organizations Millions

Update: I believe in giving credit where credit is due so it should be mentioned that this post was inspired by another blogger, David Crandall of Heroic Destiny (www.heroicdestiny.com) and on Twitter: @davidcrandall. He has good content on growing your blog through interviews, which I have also found successful over the years through my 10 Q&A posts with executives. Thanks David!

Two Sides of the Same Coin


We've worked in the field of Business Intelligence for years, cumulatively decades. During that time, we've helped clients save millions of dollars.

We've also been in management positions as the recipient of information from Business Intelligence systems. During those times, we saw business people frustrated, limited, and spending millions of dollars on systems they didn’t have to.

You Are Not Alone

We believe passionately in efficient and effective businesses; and business people being empowered with their own information. Some of you might be thinking, “We have a Data Warehouse and cubes and reports! We have what we need so what are you talking about?”

Excellent question but first I want to share with you WHY I’m even bringing this up. We sat with a prospective client today talking about their current problems. I mentioned they weren’t alone, that I’ve seen this in many organizations, and proceeded to mention a few examples. Then it dawned on me.

I don’t want to tell people “you’re not alone” anymore. I don’t want to share examples of business disempowerment. Instead, I want to tell them they are one of the few left doing it that way!

So the best way to bring about this kind of change is to give away the knowledge. This is scary in an “information is power” industry but the gains/benefits/change out weigh the competitive edge we may lose.

Getting Back to Saving Millions

So what exactly are we giving away? We are sharing with you three ways to start the change within your own organization. We have five ways but we’re keeping two for some competitive advantage!

The goals are to a) save money by reducing costs and automating repetitive tasks, and b) make better decisions with readily available, fresh, accurate information.

Here are three specific ways that can change your organization and save money:

1. Identify significant points of interest

It’s more than asking what reports they need. People require different types of information to base their decisions upon. Look for places where it’s difficult to find answers. Analysts, key individuals, management are good places to start. They may not even know the points of interest they are missing so focus on what’s known first. When points of interest are identified, better decisions can be made.

2. Free people to do more creative work

When someone is doing repetitive tasks, the same task over and over, this is a candidate for automation. When tasks are automated, it frees people to do other creative work or spending time analyzing and producing answers. Find tasks that copy data into spreadsheets, use side of desk documents or databases, or manually aggregate numbers from reports. There is enough work for people without having to do repetitive tasks.

3. Aggregate One or More Sources

Bringing sources of data together will have roadblocks. Privacy of information,who controls the data, who has access to the data are hurdles that can be overcome with the right tack and skill. The benefit is being able to manipulate and translate the data into information. Data quality improvement and aggregating multiple sources can give more accurate answers but are not always needed.

Common sense should prevail for this point. And lots of it! I’m reminded of the adage, “when you’re a hammer, everything looks like a nail”. So keep in mind a centralized data warehouse isn’t always the answer. If one already exists, adding to it isn’t always the answer either. Think: efficiency, value versus cost, and that the business is constantly changing. Typically data warehouses are unable to keep up to business change.

And here's a bonus point for 3.5 ways that we're giving away.

Different Tools for Different Roles

Finding the available tools in the Business Intelligence market is hard. There are so many. However, choosing the ‘best fit’ tool can be even harder when you include the politics, costs, and persuasive sales people. We’ll talk more about this in a later post.

You may have realized while reading this post that these techniques do more than just save money, they also help your decision makers. We find when we go through this process with clients, they come away with a focus on what they really need to know and the importance of giving decision makers and analysts access to the information.

Sunday, June 1

BI eclipsed by another technology

After reading an article on BI 2.0 thoughts came to mind that Business Intelligence has essentially become a fancy way to do organizational reporting. Nothing more. BI is simply -- reporting.

Don't confuse my simplification of BI with lack of value. BI can provide value when implemented correctly. However if you consider at a basic level, reporting displays information -- whether it's from one or more sources.

Now if I parking lot the "methods" used to bring information to the forefront (i.e. ETL) and focus on the ways customers use the results, I can consolidate this down to:
  • reports (including prompted, charts and KPI reports)
  • OLAP/cubes
I would even strongly challenge that OLAP is simply a navigable report (the answers are fixed and finite). So on the visualization side, the vendors and tools are essentially reporting tools with more features than say, 10 years ago.

In fact, looking at it that way, the acquisitions of BO, Hyperion and Cognos make sense. The acquirers (IBM, Oracle, SAP) simply needed a suite of reporting tools for their ERP applications. Because why would Oracle want their customers using IBM Cognos or SAP BO as the reporting tool on top of Oracle Financials?

Now let's be honest about the backend, ETL. This is data warehousing and DW has had a troubled history of failures. I would guess there are recent failures too. The question to customers is how much are you willing to spend to provide a finite set of inflexible answers based on today's business?

Plus the costs to maintain a data warehouse can be tremendous. In my opinion, a DW loses value a few months after go-live. I remember doing cost/benefit analysis for a government client to determine the value of paying $1m annually to maintain their DW/BI.

There was value in the information but not enough to warrant the cost. Although it was a System Integrators dream project. They didn't want to finish until every system was in the DW. The customer had a feeling of diminishing returns but waited years to do anything about it.

So is there a better way of integrating information? Well there are many techniques that are becoming mainstream, none of which would consider DW/ETL competition. These new technologies share information in real-time or near real-time (no nightly loads or checking the error log in the morning for failed batches).

And where's the new thinking for such things as integrating with information outside of the organization. Integrating and sharing information with partners. I hope BI can become more like Google. New websites are created daily and it only takes a few days before that information can be searched. And probably mostly done through automation. How long does it take for new data and reports to be provided in your BI/DW?

Friday, February 15

The SEC side-steps BI

Could the SEC be side-stepping business intelligence forcing companies to report financial data in an XML standard? Or could this turn into the investor's version of "financial intelligence"?

The SEC launched an XBRL-based online tool that allows investors to extract, compare and analyze executive compensation for large U.S. companies. This tool is so important to the SEC that they are pressing to mandate it as a requirement for all companies to post their financials for investors to view.

Investors can do analysis and reporting on companies to determine investment worthiness. And the best part, no Data Warehouse required.

Business Need: Ensure financial accuracy - In recent years, regulatory reporting requirements prescribed by new legislation, such as the Sarbanes-Oxley Act in the United States, have raised the importance of reporting accuracy and transparency.

Companies are forced to produce a public BI system, of sorts, hosted by the SEC.

Microsoft: As we know, MS Office Word and Excel have long been used to help compile, report, and consume financial information. Together, XBRL and Microsoft Office hide the complexities and shoot for wide-scale adoption in the financial community. Microsoft has a considerable lead in the market as financial people are very familiar with Excel.

With SEC's XBRL, contextual information is stored, while the language and accounting standards are irrelevant.

What is it? Extensible Business Reporting Language (XBRL) is a worldwide industry standard for the publishing, exchange, and analysis of financial reports and data based on the XML language. The XBRL technical standard is being developed by XBRL International, a not-for-profit consortium with 200+ members worldwide.

So where does this leave you if you're managing BI and your CFO needs to produce these XBRL financial filings? Most likely the financial department will want to export directly from their financial system. In my mind, this would break BI's one shared truth concept for an organization. Or does it?

This boils down to what BI is today and what BI can do for an organization in the future. Today, SEC filings may not be your BI system's mandate. In the future, BI needs to expand it's definition. Should it always include ETL and a data warehouse? Or should BI focus on delivering content throughout the organization and to external partners or customers? I think the later.

BI has potential but is rot with problems -- failed projects, high costs, low returns. Some organizations have made BI very successful. The US Veterans Affairs is one of the largest Microsoft Analysis Services deployments in the world with a profound cost savings of over a billion dollars! Now that is successful BI!

So you may want to consider how XBRL should be apart of your BI system using an overall mandate of providing content to the masses. As for XBRL, couldn't they at least come up with a friendlier acronym!?

Sunday, January 27

Strategy & Leadership in January 2008

I came across Erin McCune's post on Leadership is Critical to Project Success on the Forte Financial blog. She references an earlier post of mine on Business vs IT (appreciated) but I would have to say she adds a more important educational component.

Thanks, Erin, for sending out that January 2008 Harvard Business Review is dedicated to Leadership & Strategy. Some of the HBR topics below could be interesting... guess I'll find out when I start reading on the weekend.

  • The New Leader's Guide to Diagnosing the Business

  • How Star Women Build Portable Skills

  • The Existential Necessity of Midlife Change

  • The Experience Trap

  • The Founder's Dilemma

And just before I left Erin's blog, I saw her latest post on XBRL tools making reporting easier. The tool she references "maps data stored in separate systems and proprietary formats into XBRL so that it is easy to share for reporting and analysis". Excellent idea for using an open standard.

The tool by Enterprise Engineering, Inc, is an XBRL-based analytical tool that makes it possible to compare a company’s income statement, balance sheet and other financial reports to peers and industries.

However, hard to find BI vendor tools that use the XBRL standard in a non-proprietary way.

Friday, October 20

Executive reporting? free ebook (for now)


Executive reporting is changing. Or rather the way executives are doing organization-wide reporting is. Consuming information is at an all time high. Executives want to act before they have to react to the market, competition, and other conditions.

This Executive Reporting ebook I'm publishing is not about selling you on one service or another. Nor does it recommend a product or tool. Instead it is about giving you tried ideas that worked for management groups in government and private firms. In a condensed, easily consumable form.

Download pdf here.

I'm sure this ebook is incomplete. But that's why I left the option open for future issues. I hope this encourages you to think and pay attention to what other organizations are doing. And it's free. And it is small enough to email to colleagues or post on your own site.

Thanks for reading.

Tuesday, September 19

Executive reports on your Blackberry


When you need to check the performance (or under-performance) of a business unit, geographic region, or sales numbers for a department, it is difficult to do this on the road. Shawn writes that Cognos can now do this for your Blackberry.

Being less tied to your computer or laptop for information will keep you mobile (especially for those who spend a great deal of time traveling or going to meetings 8 hours a day). You want the "right" information pushed to you on a regular basis without involving a bunch of people or asking IT.

Information you want; when you need it.

The key will be giving executives information that works on the 3 inch Blackberry-type screens. The days of the "one-page-wonder" where all your information is on one report will be history. But replaced with simple, clear, concise, to-the-point, and actionable information.

People will become accustom to charts and data that relate to key performance information. When people are accountable and gauged on a small number of key performance measures, people tend to focus.

There is a downside to being too focused though. More about that later.

Friday, May 12

Visualize your data creatively

Ever find yourself stuck creating an endless number of bar graphs for your management PowerPoint presentations? Graphs were meant to catch your eye and deliver relevant information quickly (and perhaps prevent the audience from dozing off).

Here are some inspirational graphs by Karl Hartig that have been taken to an art form and published in the Wall Street Journal.

Then there are cartograms where the size of the country changes according to a variable. For example, compare all countries in the world to their the GDP or number of people with AIDS.

Tuesday, April 18

Be clear when reporting performance

The process for performance reporting may be rot with manual effort, costs, time and money but the end result, the monthly, quarterly or annual report, should be presented with a clear and relevant message.

Yesterday, I was given a set of principles for performance reporting used by a state level government. These principles are used as guidelines to produce quarterly/annual reports for public consumption. This guide could be used for internal publications too.

(liberties taken to protect the innocent)

Explain the organization - the why, what, who, how but also how its services are delivered and how it conducts its work. Let the public know the significance of the performance information being reported.

Link goals and results - what the organization intended to achieve and whether they are on track. Provide information where the public can make reasonable judgments about government performance.

Focus on a few critical aspects - limit the goals, objectives, and measures to a critical few that show key issues. The public will have a clear and concise picture of the performance and areas for improvement.

Link resources, strategies, and results - link financial and performance information to show how resources and strategies influence results. This leads to discussions about the choices that government makes and the impact of choices on the people it serves.

Provide comparative information - put expected future results in context by comparing past information and performance of other similar organizations or industry benchmarks. Trend information can help the audience tell whether there is improvements, deterioration, or static performance.

Present credible information - information is based on quantitative and qualitative information that should be fairly interpreted. It should be relevant and reliable, consistent and understandable.

Disclose the basis for judgements - should disclose how the information has been prepared and the limitations that apply to its use. The public will better understand how the performance report should be used.

Friday, March 24

Got a Dashboard?


A recent survey/article stated "Such technology is sorely needed". Many companies are on their first generation of dashboard or performance management project. Some have 'pockets' of implementations within divisions with the long-term goal of a corporate dashboard.

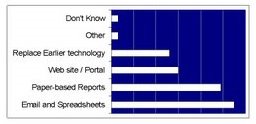
The graph above shows the Oracle User Group's survey on what clients are replacing on their dashboard projects.

The technology, for the most part, is now available and mature (not all vendors are at the same maturity though). The business has been waiting for easy-to-understand views into their executive information for as long as some people have waited for the 80's fashion styles to come back.

So where are the dashboards?

Most are still using spreadsheets and paper-based reports (according to Oracle users). All that effort put into strategic & financial planning only to show the leaders in your company an Excel spreadsheet? You say you don't have any other tools? But what a great position to be in for initiating your own dashboard project. Ask a vendor to show you a demo. Ask an executive what she would like. And get people in your company excited. That's a start.